Setup Graphics
Overview
Graphics are the images used to create designs inside our tool. On the Control Panel you can set up a library of specific graphics matching your project.
They can be set up as raster or vector images, with different colorization options.
How to add graphics?
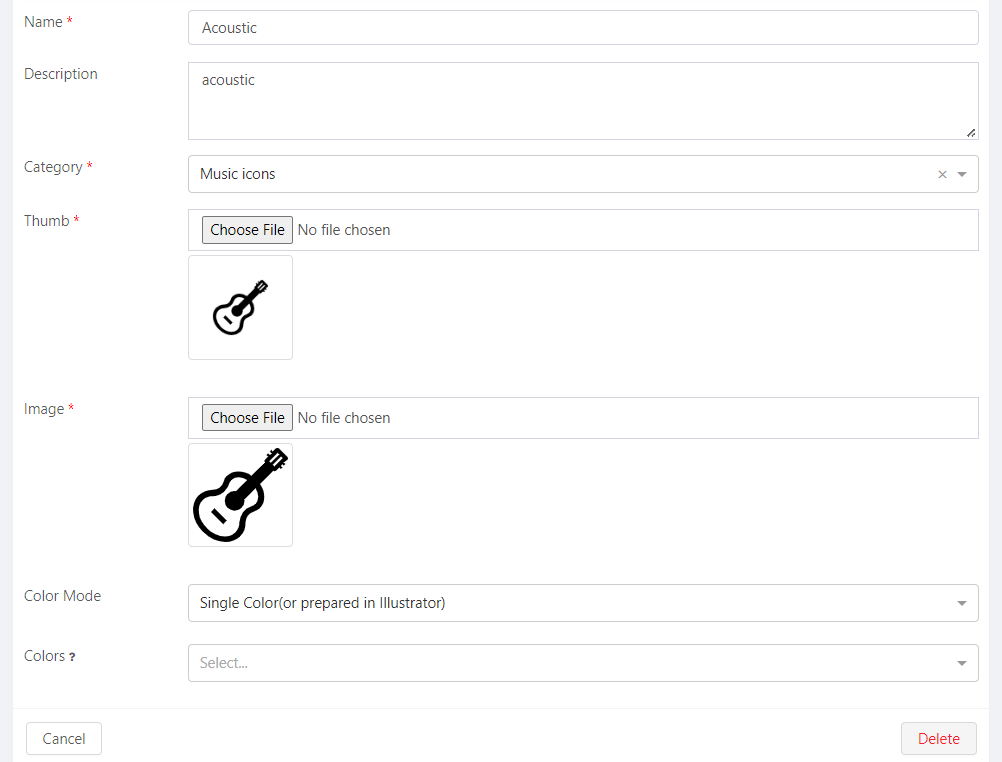
To start adding new graphics:
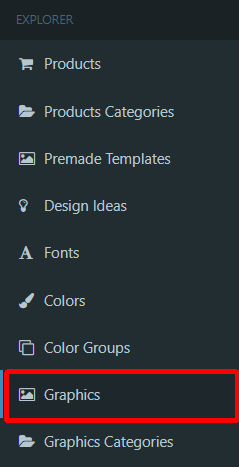
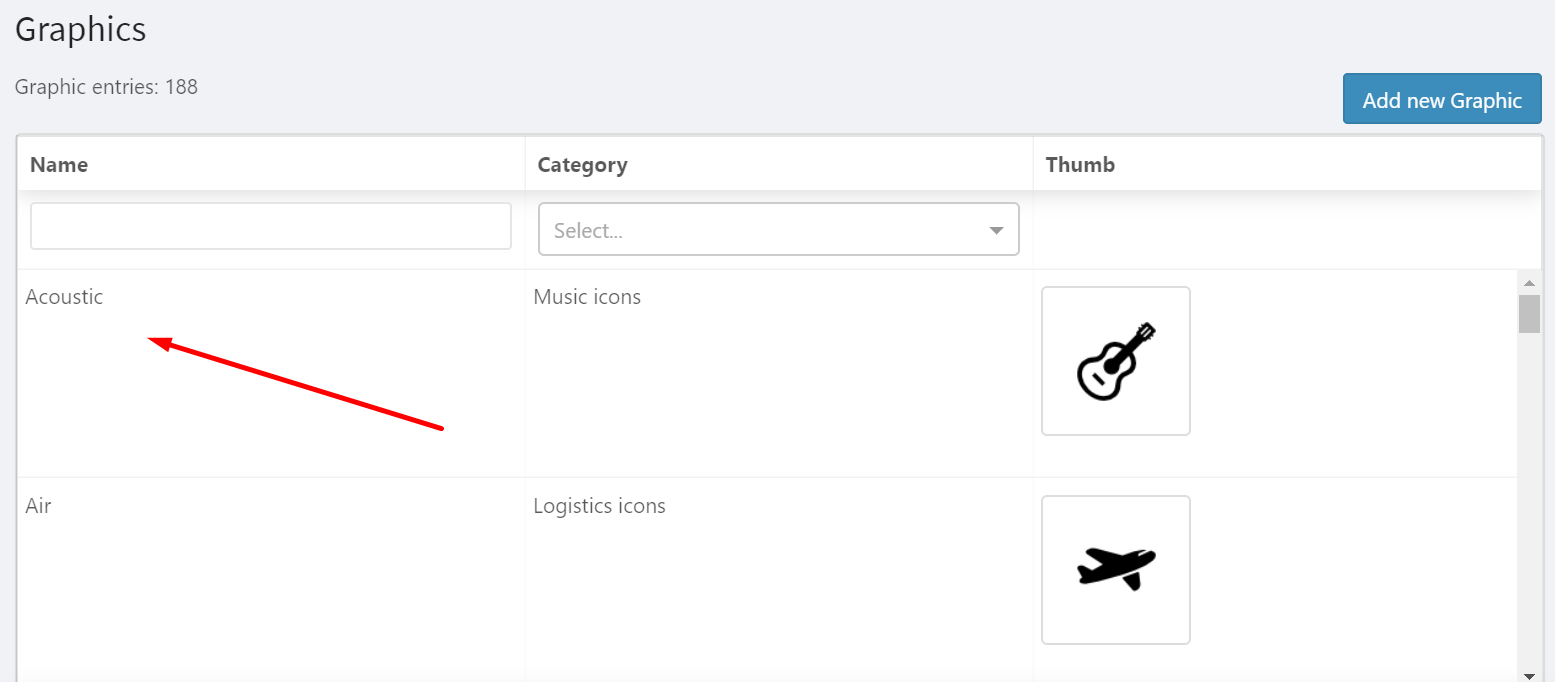
Choose "Graphics" from the Explorer.
Click on the "Add new Graphic".

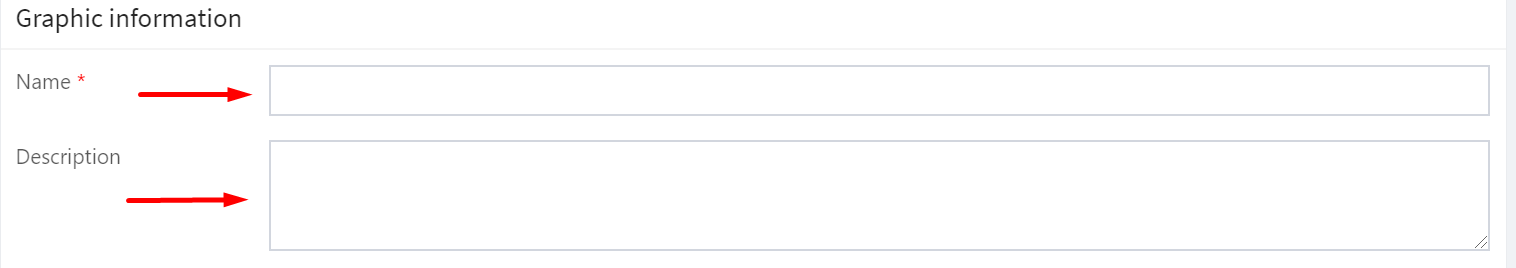
Enter the Name and Description (short description of the image, visible to the end-user) of the graphic.
Choose Category (See "How to add the graphics category").

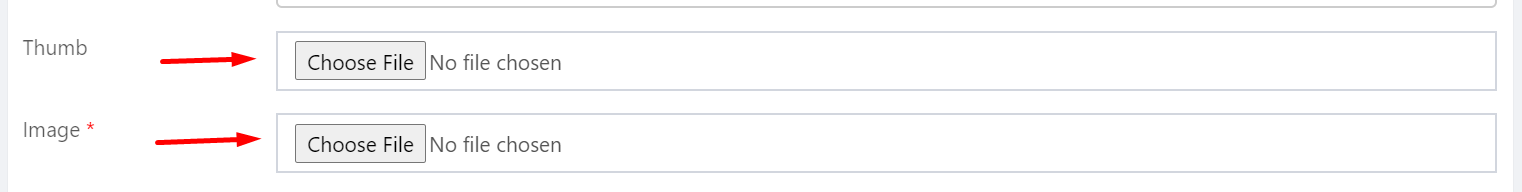
Upload Image and Thumbnail (reduced-size version of the image). We recommend using a raster image 110x110px maximum. If the image proportions are larger the image will be automatically resized to fit the 110x110px.
Choose Color Mode and Colors.
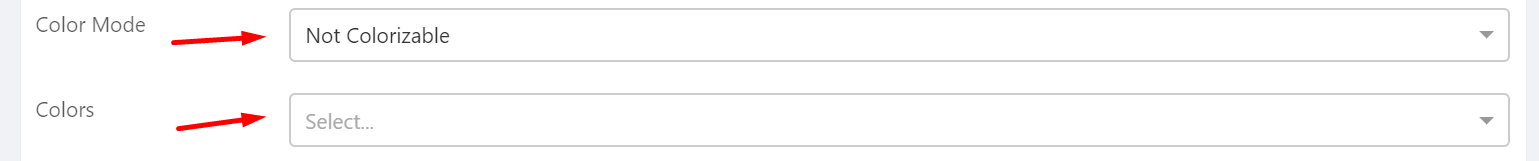
Color Mode: Not Colorizable. Is used for raster images which cannot be colorized.

Color Mode: Single Color. Is used for vector images. The whole image can be colorized in one color from available list of colors.

Color Mode: Multicolor: Auto-parse colors. Is used for vector images. The image colors will be automatically parsed by designer depending on the number of configured colorizable areas the image has. The user will be able to change these colors further from available list of colors.

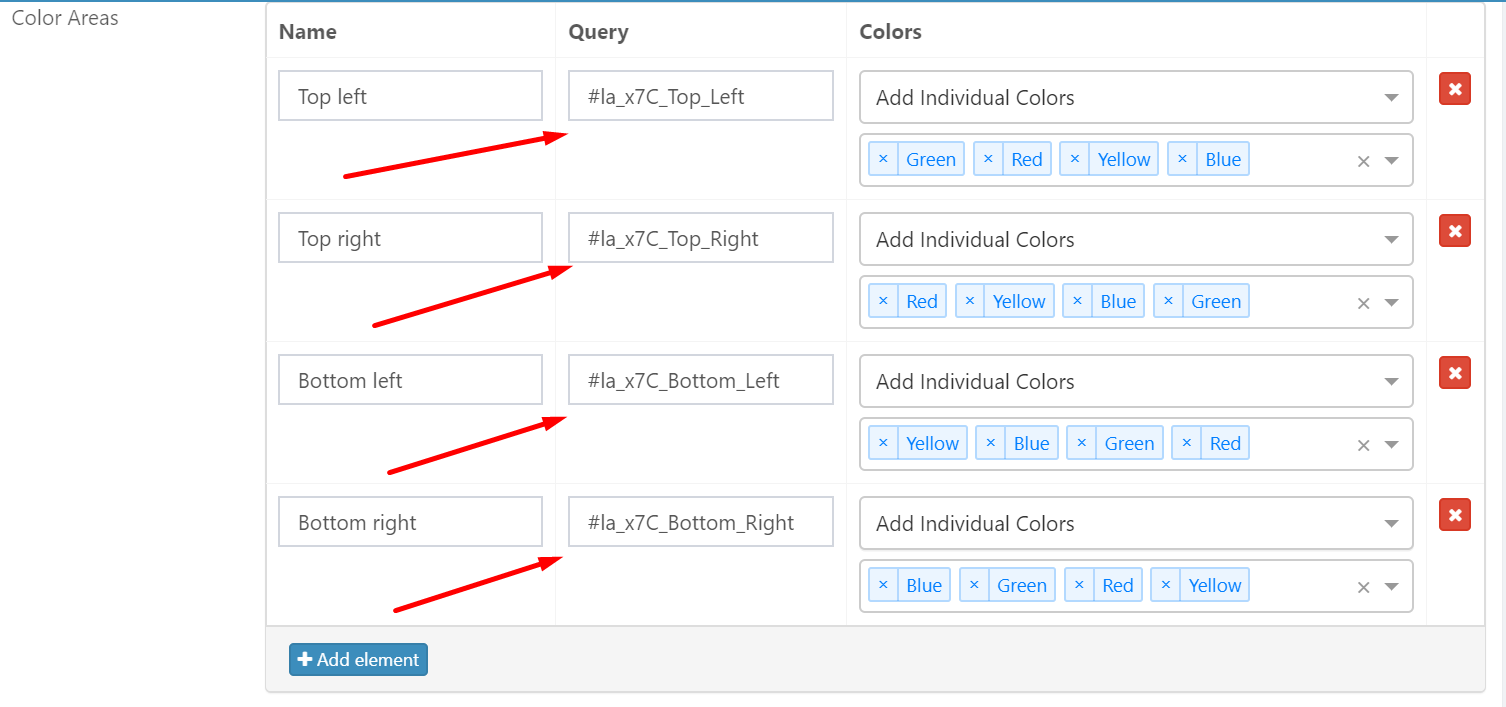
- Color Mode: Multicolor: Configure Color Areas. Is used for vector SVG images. You will be able to configure color areas manually. For every color area you will be able to set specific colors. If you do not select any colors, then the user will be able to choose from the list of all available colors. Please see detailed SVG grapics preparation guide.
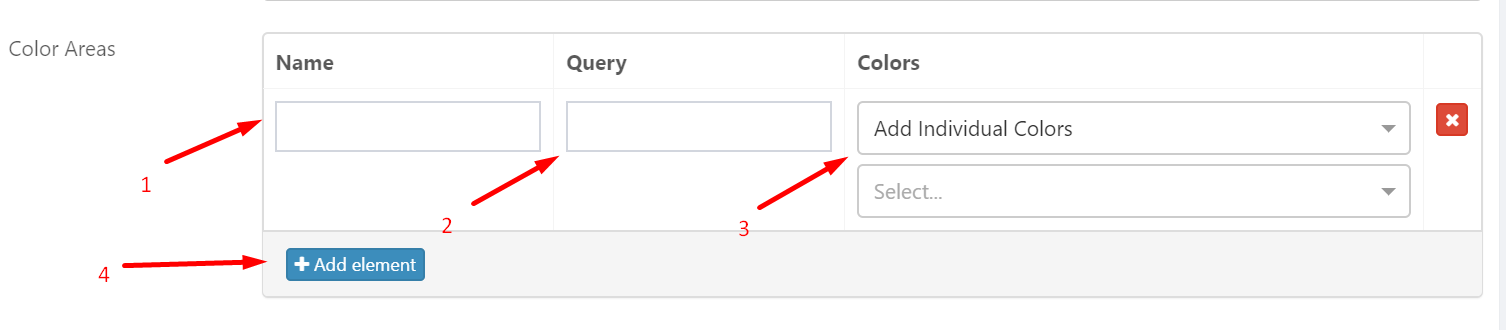
Enter the Name of the color area.
Enter the Query - a CSS id of the image element for the area you'd like to colorize. To find query:
- Click on the Image:
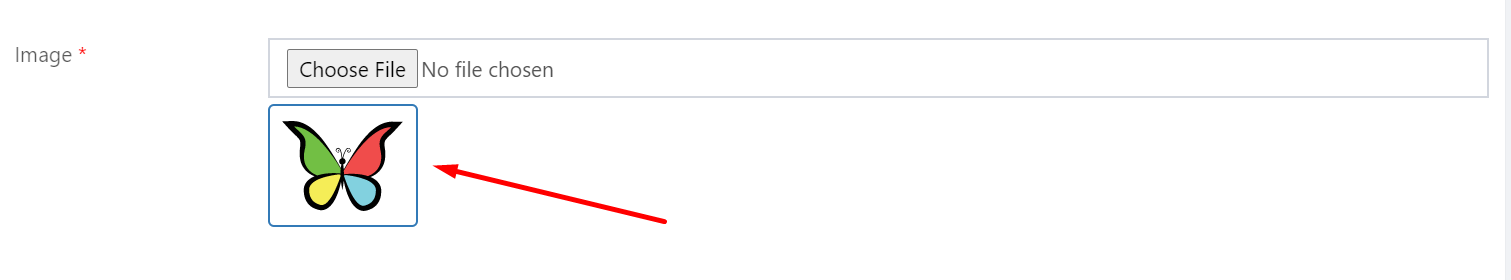
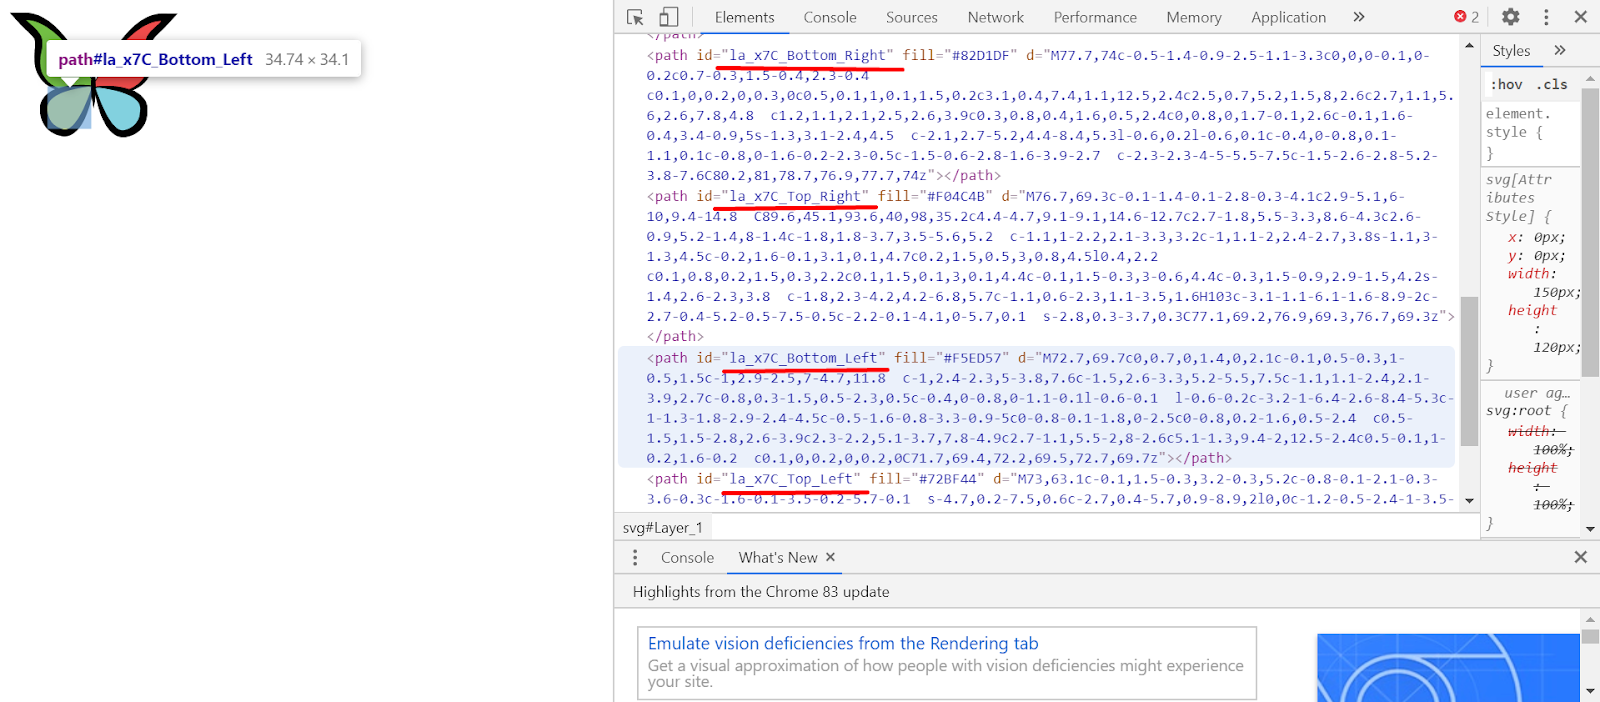
The image will be opened in a separate window. Click on the right mouse button and choose "Inspect".
Copy colorizable area id and paste it into the Query. For example, this graphic image has four colorizable areas so that you can apply colors for these areas respectively.
In admin area it will look:
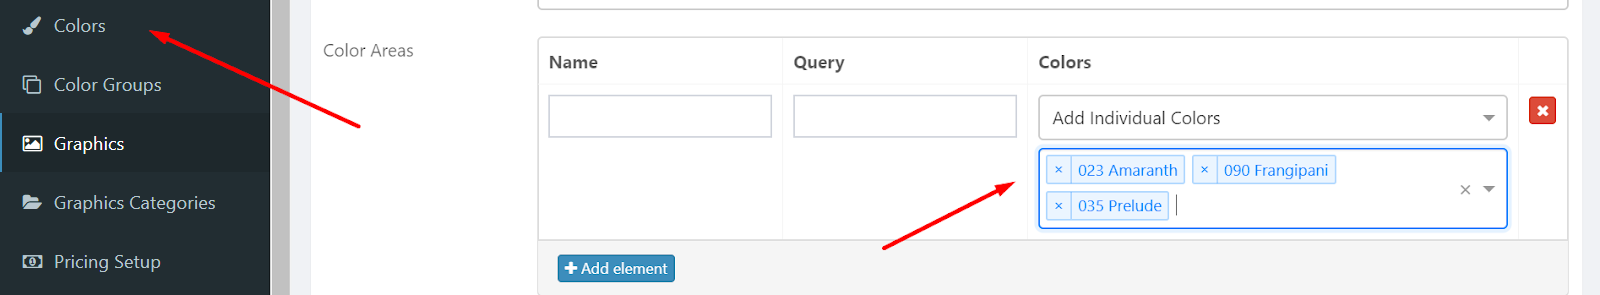
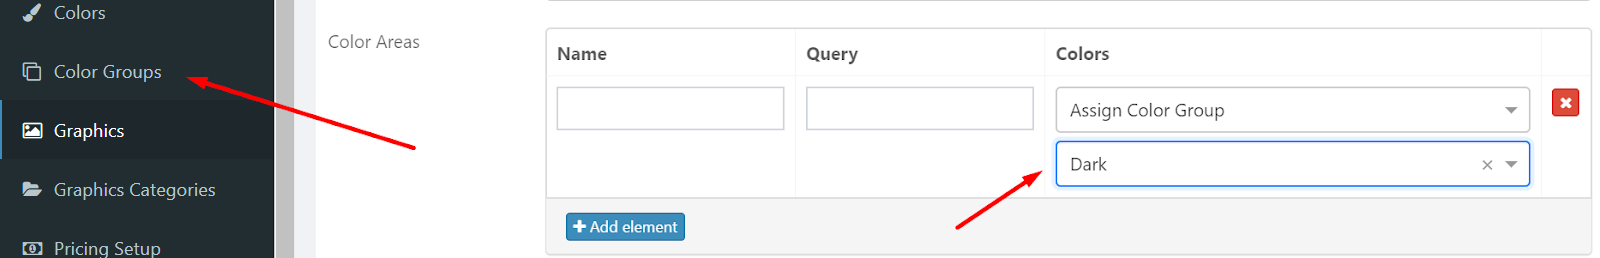
Select colors from the list:
- Add Individual Colors - you can individually add colors from all the available colors in the admin panel. You can see all the available colors and configure them in "Colors" in the Explorer. Leave input blank to use all the available colors.
- Assign Color Group - you can select color group of the pop-up and all colors that are contained in selected color group will be available for Color Area. You can see all the available color groups and configure them in "Color Groups" in the Explorer.
- Color Wheel - arbitrary colors can be applied.
- Choose colors. Here you can define colors the graphics has which may affect the final quote. See (How to setup pricing rules)
Click on Save to create a new Graphic.

How to edit graphics?
To start editing graphics:
- Choose "Graphics" from the Explorer.
- Choose the graphic you want to edit from the list.
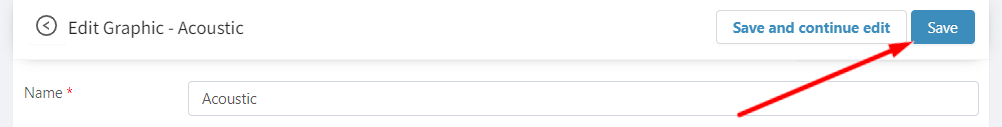
- Edit options from the list of options.
- Click on "Save" to save changes.